COBE: WebGL Globe in 5kB
This blog post was originally published as a Tweet thread.
COBE
5kB WebGL globe lib.
https://github.com/shuding/cobe
I made github.com/shuding/cobe a while ago: a 5kB globe lib, and it improved our page performance by almost 60%. How was it created?
First of all, today's popular WebGL libs are usually sized at hundreds of kilobytes, but there are also lightweight choices such as github.com/vaneenige/phenomenon and github.com/xem/W. All of them are wrappers on top of the WebGL standard APIs, but with different feature sets.
Earlier this year we were using a Three.js based solution. The globe is a SphereGeometry that loads the full world map JPEG as texture. Every visitor will spend ~40kB loading that image, and it still felt blurry so we couldn't optimize it further.
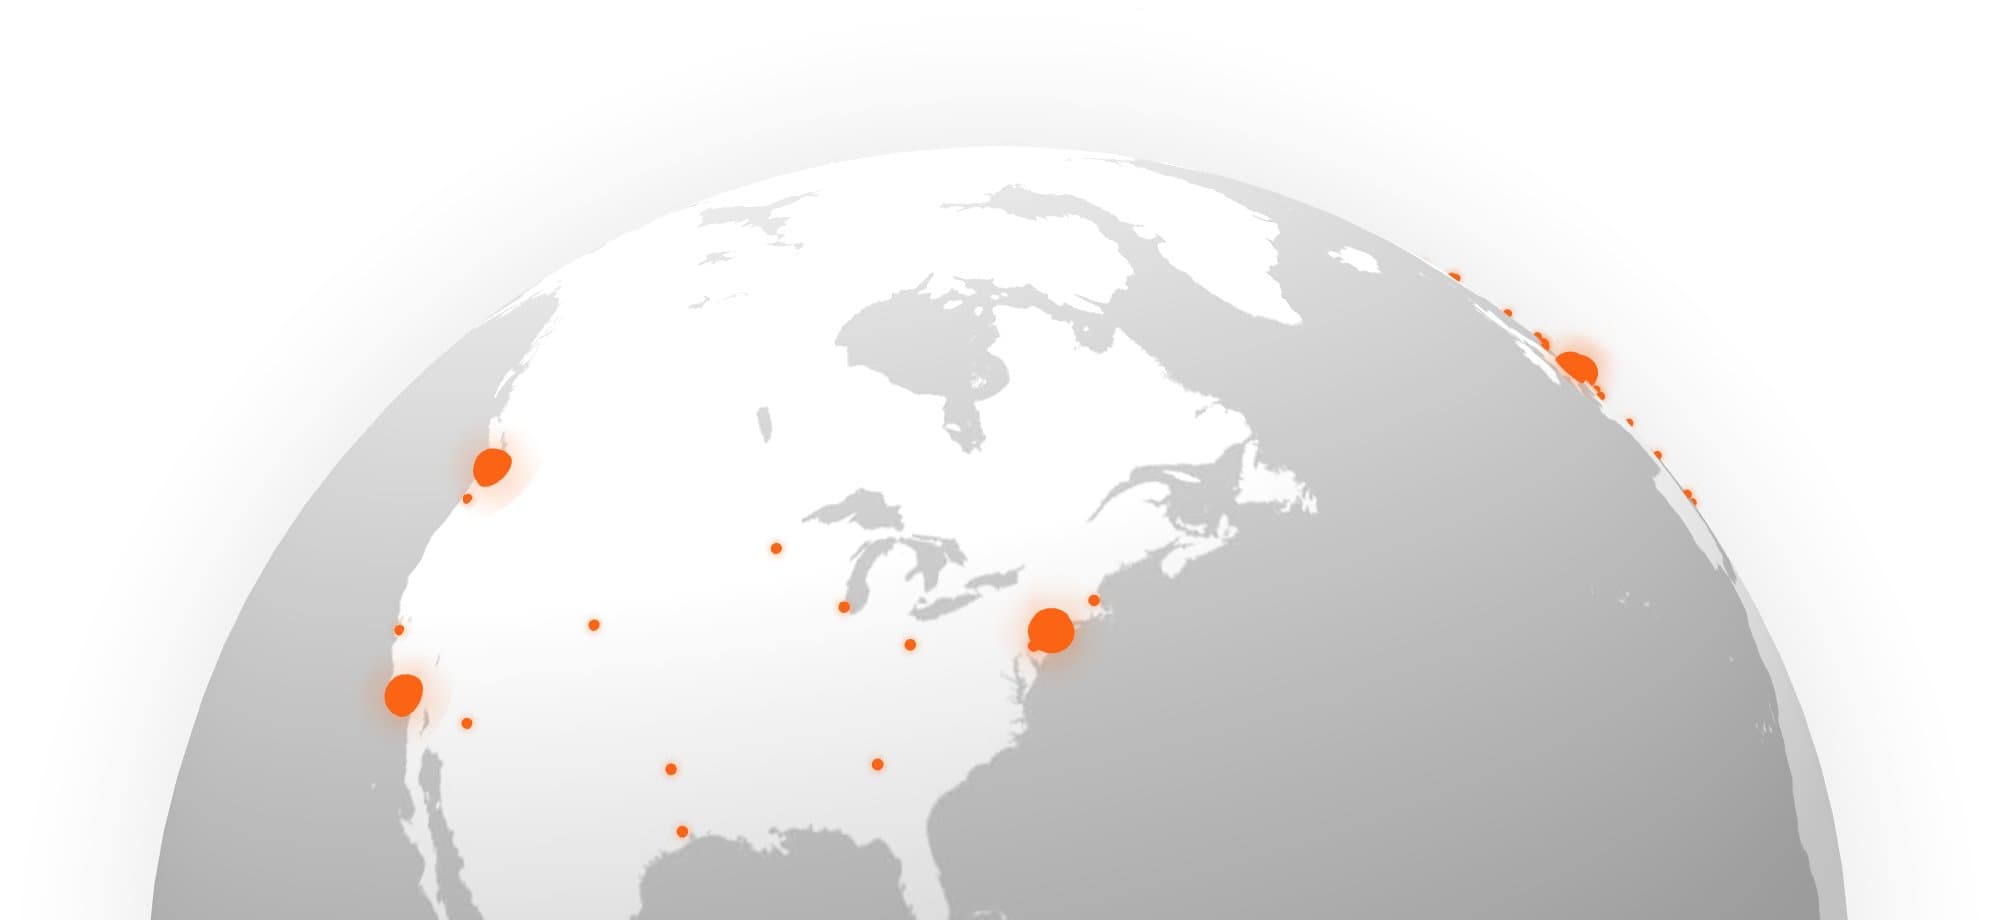
We tried to set a higher texture anisotropy (threejs.org/docs/#api/en/textures/Texture.anisotropy) which improved it a bit, but that's still a trade-off between performance and quality.
Some day I read this great post by GitHub: How we built the GitHub globe. They're not rendering an image, but thousands of dots, on the globe. So a lot of information loss (size win!): no more sharp edges and rich detail, but still looking amazing.
How we built the GitHub globe | The GitHub Blog
GitHub is where the world builds software. More than 56 million developers around the world build and work together on GitHub. With our new homepage, we wanted to show how open source development transcends the borders we’re living in and to tell our product story through the lens of a developer’s journey. Now that it’s […]
https://github.blog/2020-12-21-how-we-built-the-github-globe/
But one bottleneck in that GitHub approach is, they have to reduce the number of dots from ~12,000 to ~8,000 to keep it fast, because they are using a loop to generate those samples. However the work here can be parallelized. The idea of using a shader came to my mind naturally.
To start with that idea, let's create a shader to draw a sphere, and a 4096×2048 world map as the texture (80kB):

color = isOnLand(x, y) ? light : dark
Then we can render some kind of lattice on the globe, like this a basic one:
color = isOnDot(x, y) ? light : dark
By multiplying them, you get a dotted world map:

color = isOnLand(x, y) && isOnDot(x, y) ? light : dark
It's interesting that, thanks to the sampling, if you downscale that texture from 4096×2048 (80kB) to 256×128 (1kB), the dotted world maps look almost the same! Since it's small enough, I just inlined it in the lib as a base64 string:
data:image/png;base64,iVBORw0KGgoAAAANSUhEUgAAAQAAAACAAQAAAADMzoqnAAAAAXNSR0IArs4c6QAABA5JREFUeNrV179uHEUAx/Hf3JpbF+E2VASBsmVKTBcpKJs3SMEDcDwBiVJAAewYEBUivIHT0uUBIt0YCovKD0CRjUC4QfHYh8hYXu+P25vZ2Zm9c66gMd/GJ/tz82d3bk8GN4SrByYF2366FNTACIAkivVAAazQdnf3MvAlbNUQfOPAdQDvSAimMWhwy4I2g4SU+Kp04ISLpPBAKLxPyic3O/CCi+Y7rUJbiodcpDOFY7CgxCEXmdYD2EYK2s5lApOx5pEDDYCUwM1XdJUwBV11QQMg59kePSCaPAASQMEL2hwo6TJFgxpg+TgC2ymXPbuvc40awr3D1QCFfbH9kcoqAOkZozpQo0aqAGQRKCog/+tjkgbNFEtg2FffBvBGlSxHoAaAa1u6X4PBAwDiR8FFsrQgeUhfJTSALaB9jy5NCybJPn1SVFiWk7ywN+KzhH1aKAuydhGkbEF4lWohLXDXavlyFgHY7LBnLRdlAP6BS5Cc8RfVDXbkwN/oIvmY+6obbNeBP0JwTuMGu9gTzy1Q4RS/cWpfzszeYwd+CAFrtBW/Hur0gLbJGlD+/OjVwe/drfBxkbbg63dndEDfiEBlAd7ac0BPe1D6Jd8dfbLH+RI0OzseFB5s01/M+gMdAeluLOCAuaUA9Lezo/vSgXoCX9rtEiXnp7Q1W/CNyWcd8DXoS6jH/YZ5vAJEWY2dXFQe2TUgaFaNejCzJ98g6HnlVrsE58sDcYqg+9XY75fPqdoh/kRQWiXKg8MWlJQxUFMPjqnyujhFBE7UxIMjyszk0QwQlFsezImsyvUYYYVED2pk6m0Tg8T04Fwjk2kdAwSACqlM6gRRt3vQYAFGX0Ah7Ebx1H+MDRI5ui0QldH4j7FGcm90XdxD2Jg1AOEAVAKhEFXSn4cKUELurIAKwJ3MArypPscQaLhJFICJ0ohjDySAdH8AhDtCiTuMycH8CXzhH9jUACAO5uMhoAwA5i+T6WAKmmAqnLy80wxHqIPFYpqCwxGaYLt4Dyievg5kEoVEUAhs6pqKgFtDQYOuaXypaWKQfIuwwoGSZgfLsu/XAtI8cGN+h7Cc1A5oLOMhwlIPXuhu48AIvsSBkvtV9wsJRKCyYLfq5lTrQMFd1a262oqBck9K1V0YjQg0iEYYgpS1A9GlXQV5cykwm4A7BzVsxQqo7E+zCegO7Ma7yKgsuOcfKbMBwLC8wvVNYDsANYalEpOAa6zpWjTeMKGwEwC1CiQewJc5EKfgy7GmRAZA4vUVGwE2dPM/g0xuAInE/yG5aZ8ISxWGfYigUVbdyBElTHh2uCwGdfCkOLGgQVBh3Ewp+/QK4CDlR5Ws/Zf7yhCf8pH7vinWAvoVCQ6zz0NX5V/6GkAVV+2/5qsJ/gU8bsxpM8IeAQAAAABJRU5ErkJggg==
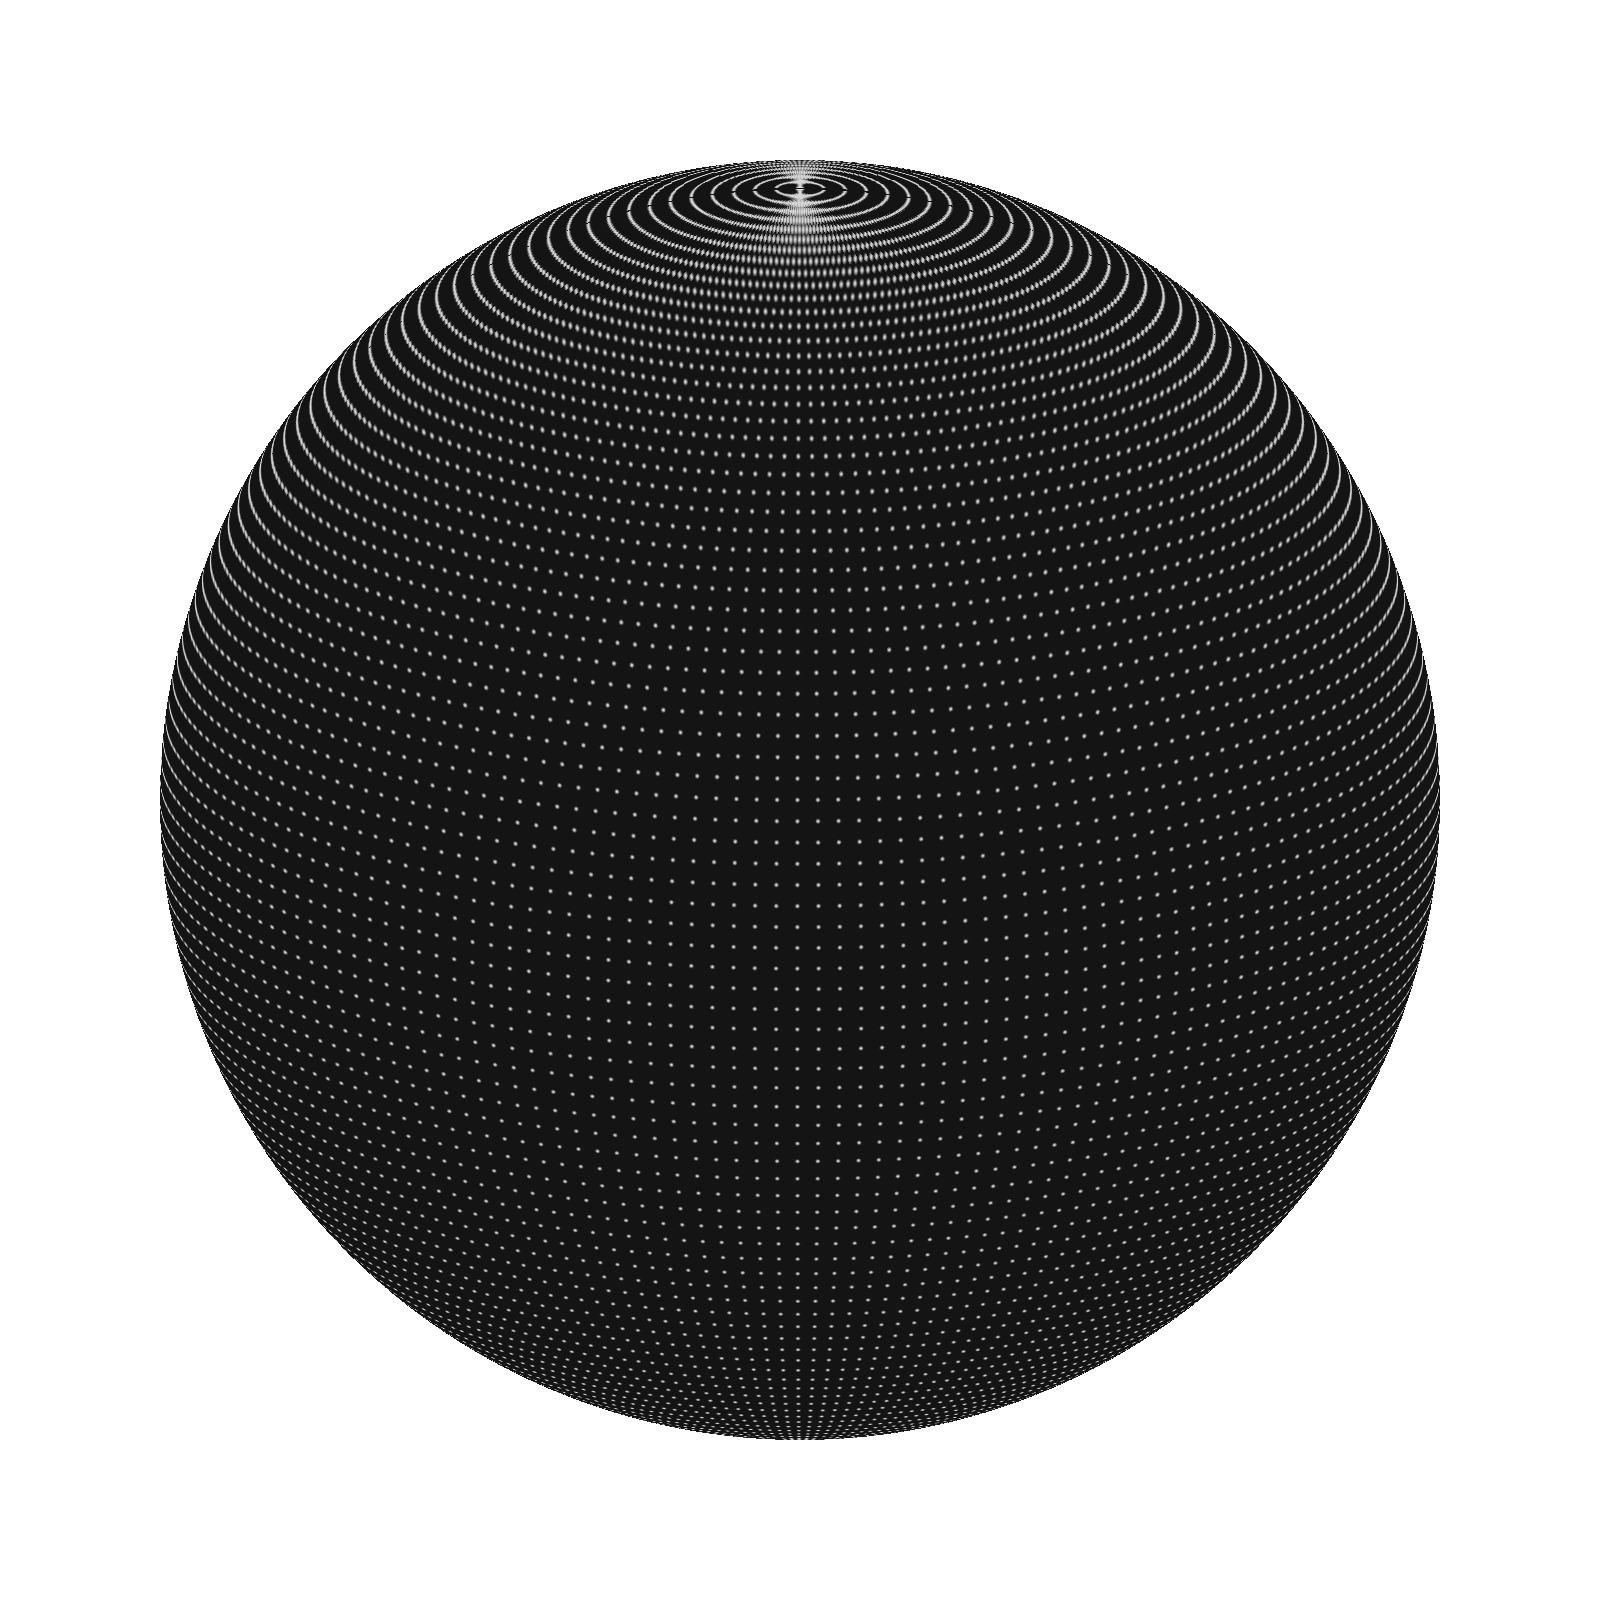
You might noticed that the sampling doesn't feel good especially near the North Pole. That's because we are evenly putting samples by longitude and latitude, not by density. A better way is Spherical Fibonacci Lattice, example by @mbostock:

Spherical Fibonacci Lattice
Ref. extremelearning.com.au The lattice is expressed as a sequence of points in the unit square . Each point is converted to spherical coordinates (longitude and latitude in radians) by the inverse cylindrical equal area projection: . Appendix
https://observablehq.com/@mbostock/spherical-fibonacci-lattice
There's also an excellent animation by @cristobalvila showing the math behind this:

Nature by Numbers
A movie inspired on numbers, geometry and nature, by Cristóbal Vila
https://www.youtube.com/watch?v=kkGeOWYOFoA
But one blocker was, to use a shader we have to compute the nearest point in the Fibonacci lattice from the current coordinates. Whereas most implementations today are producing these points kinda "unpredictably", which makes it difficult to render on a GPU.
Then I saw shadertoy.com/view/lllXz4 created by @iquilezles, which implemented an algorithm to map a point on a sphere to its closest Spherical Fibonacci point! Here's the paper if you are interested: Spherical Fibonacci Mapping.
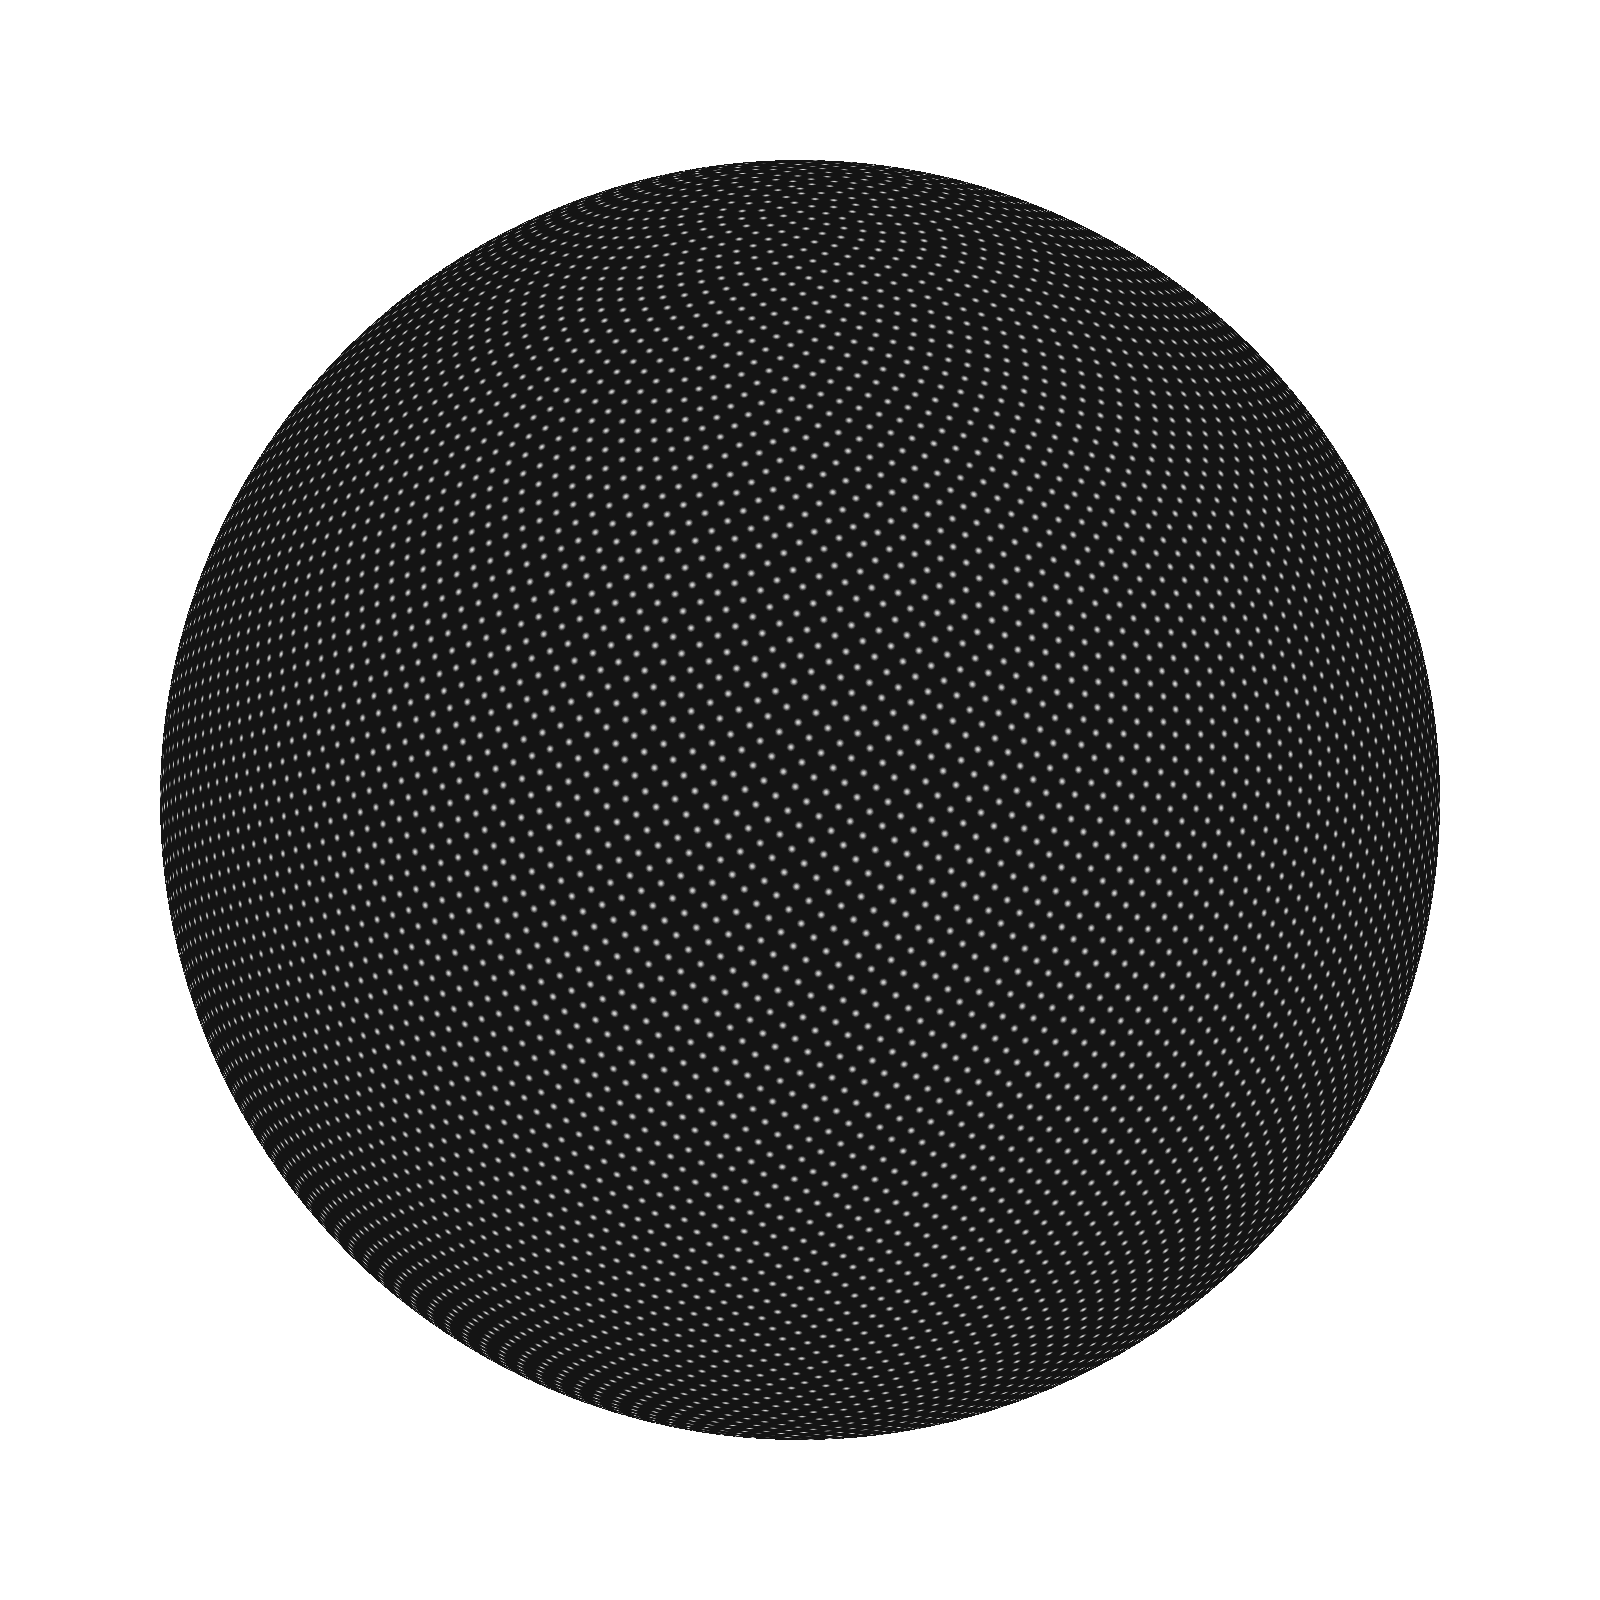
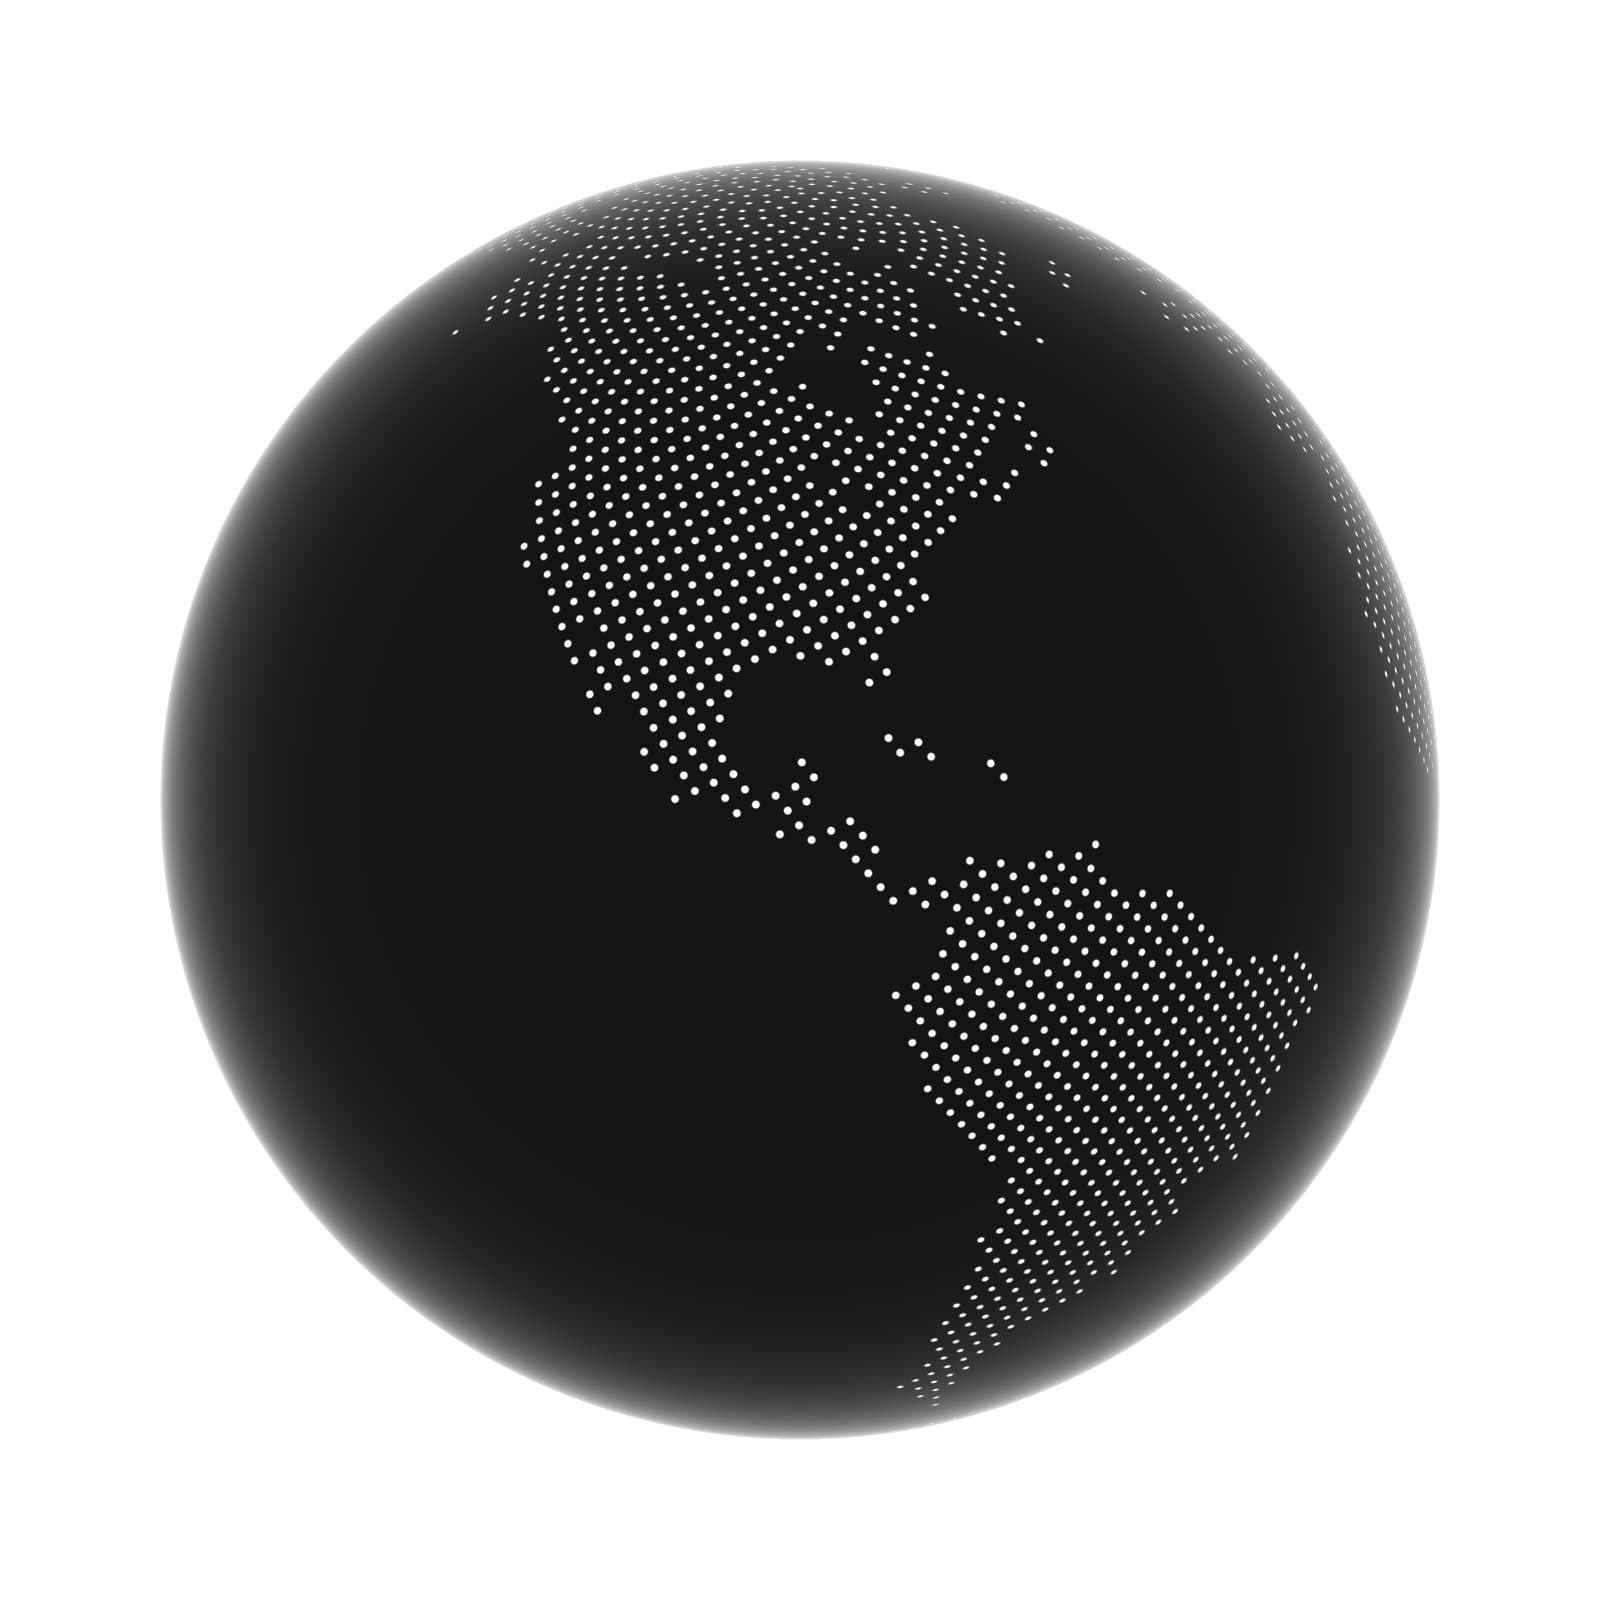
So now we finally got everything ready. The sampling looks good with the new algorithm:

We also got rid of the precision error by rounding before sin/cos as well as @farteryhr’s amazing mantissa trick, if you want to know more about that part:
- https://twitter.com/shuding/status/1470068674560155650
- https://github.com/shuding/cobe/pull/8
- https://github.com/shuding/cobe/pull/9
Finally, we can add some phong lighting and glow effect to make it look good. And the last step is to use @evanwallace’s glslx to compress the shader for distribution.
This library now powers vercel.com and vercel.com/edge :)

Develop. Preview. Ship. For the best frontend teams – Vercel
Deploy web projects with the best frontend developer experience and highest end-user performance.
https://vercel.com